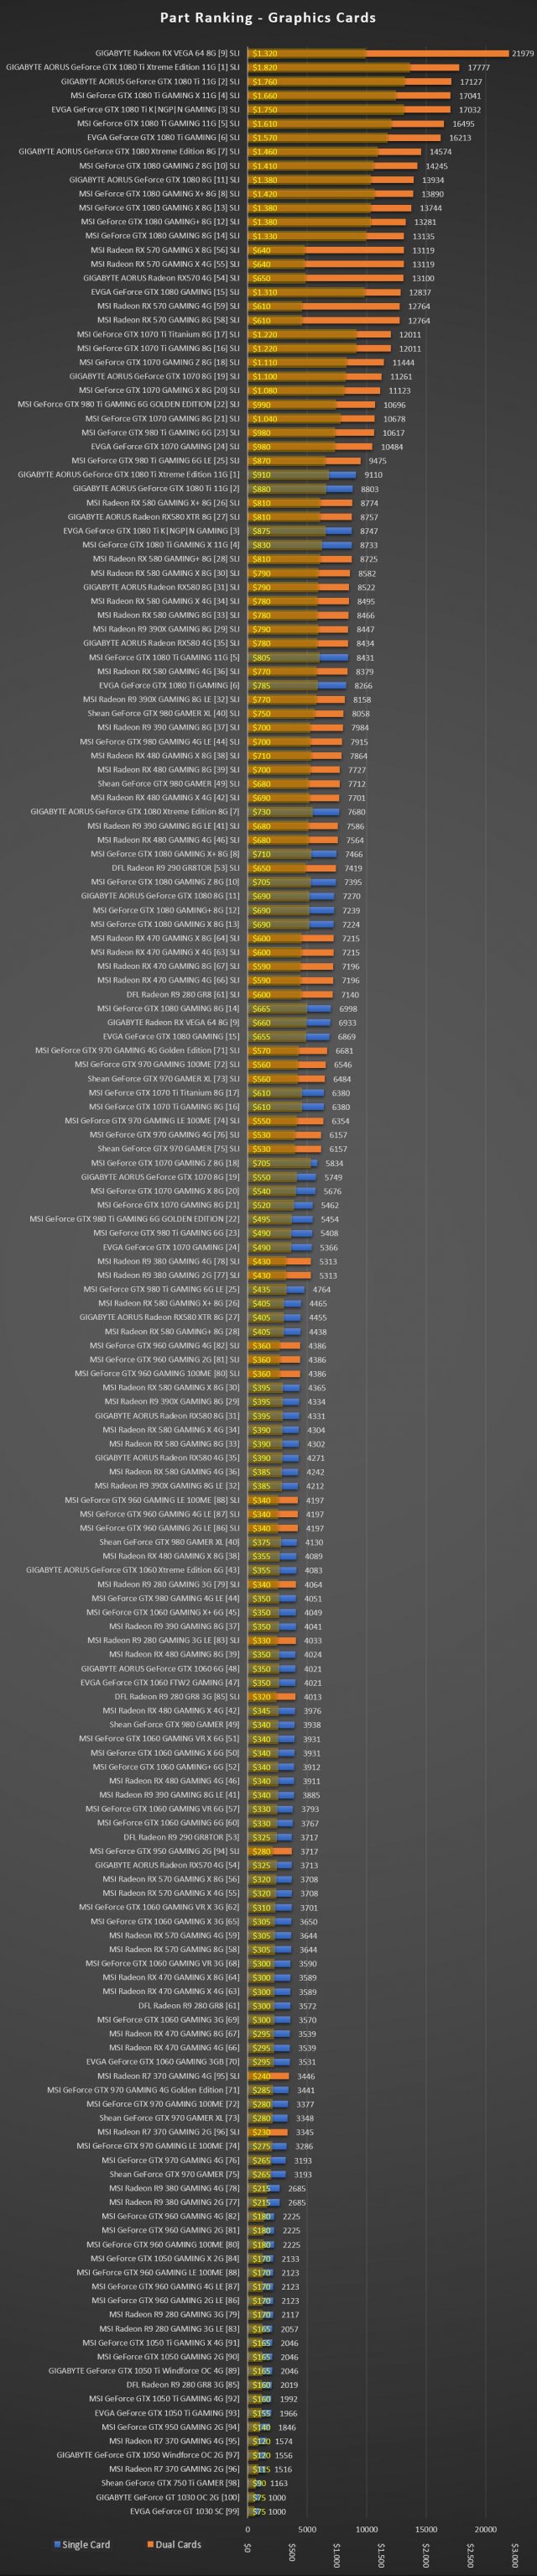
The In-game Part Ranking chart is slightly misleading. The actual 3D Mark performance rank of some cards are lower than they appear in the chart. Here are some helpful charts with more accurate numbers.
Part Ranking - Graphics Cards
- This is the Part Ranking chart for SLI/CrossFire cards alongside single cards.
- The chart here is rearranged according to actual performance numbers.
- SLI/CrossFire configurations and costs are marked for ease of use.
The SLI notation denotes 2 cards of the same type in SLI or CrossFire configuration.
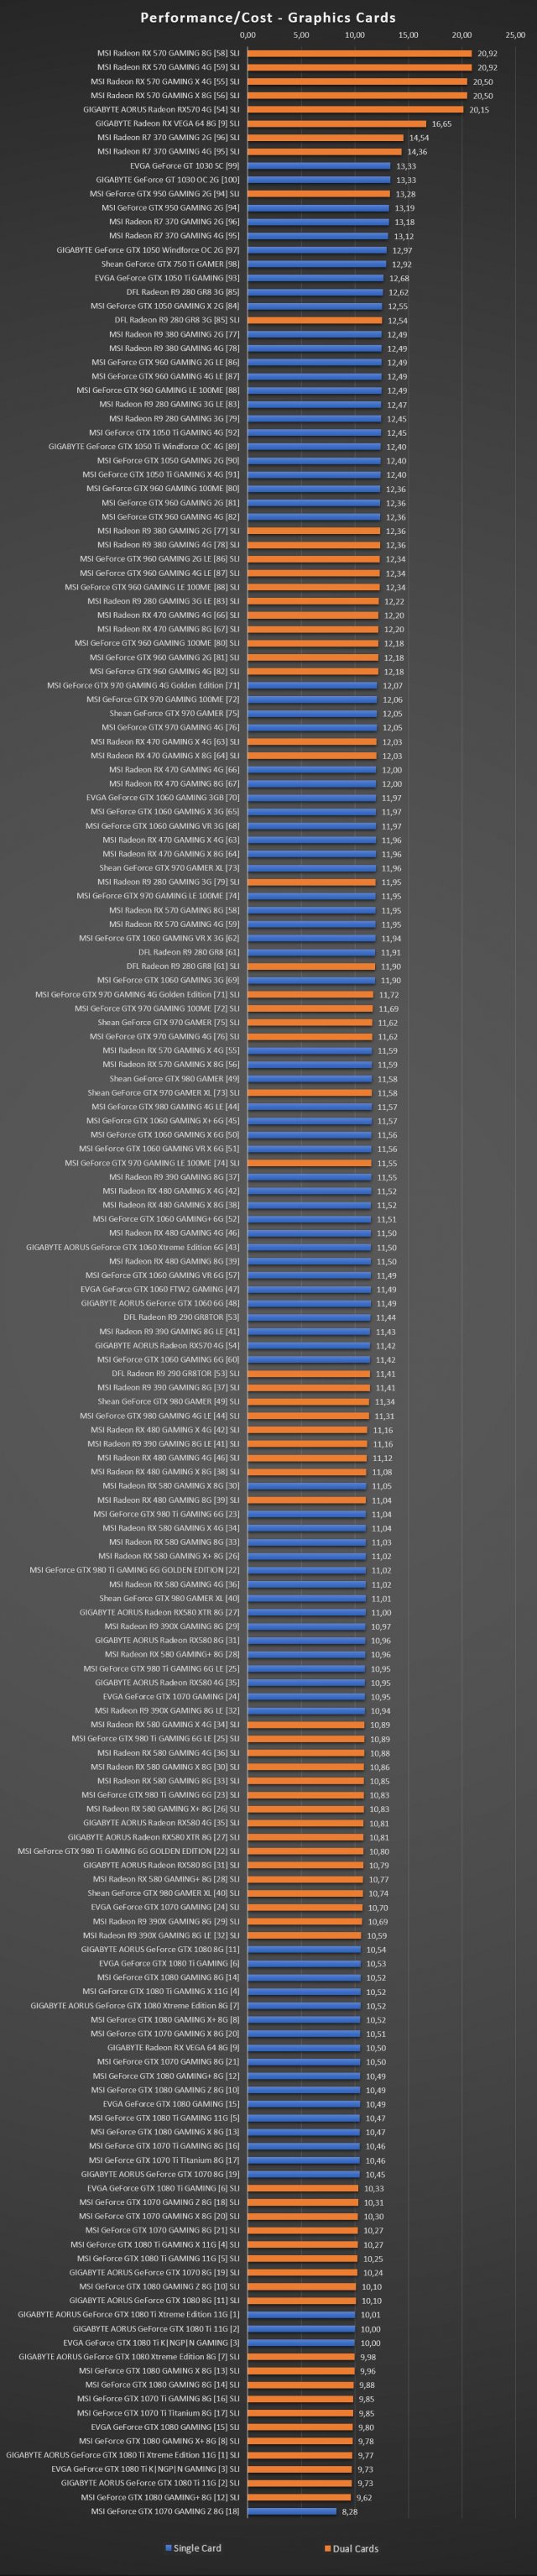
Performance / Cost - Graphics Cards
- This is the Performance/Cost chart for all GPU configurations.
- The chart here is rearranged according to actual performance numbers.
- SLI/CrossFire configurations are marked for ease of use.
- The higher the value, the better cost-benefit you're getting!
The SLI notation denotes 2 cards of the same type in SLI or CrossFire configuration.
Part Ranking - Processors
- This is the Part Ranking chart for all CPUs.
- The chart here is rearranged according to actual performance numbers.
- This does not take into account RAM configurations. This is only performance values of the CPUs.
Performance / Cost - Processors
- This is the Performance/Cost chart for all CPUs.
- The chart here is rearranged according to actual performance numbers.
- This does not take into account RAM configurations. This is only performance values of the CPUs.
- The higher the value, the better cost-benefit you're getting!
Source: https://gameplay.tips/guides/2303-pc-building-simulator.html
More PC Building Simulator guilds
- All Guilds
- how 2 jump
- PC Building Simulator Guide 9
- How does RAM affect CPU score
- PCBS [RUS]
- Earn Money Faster & Maximize Profits
- PC Building Simulator - Career Mode Tips
- PC Building Simulator - 20K 3DMARK Build for the Achievement (Blow 'em Away)
- PC Building Simulator - Beginner Tips
- PC Building Simulator - BSOD Guide (Blue Screen of Death)